Description
Cardiolink is a fully browser-based telemedical platform for ECG holter and sleep breathing disorders examinations. It covers the whole process from starting a patient’s card, through making an order, logistics, dispatch of the device, live examination monitoring to analyzing and generating a report. It works along separately developed med recorder device.
Role
During the first phase of the project I was responsible for gathering data, performing individual in-depth interviews with cardiologists and pulmonologists, analyzing findings and preparing prototypes.
Based on the acquired knowledge, needs of the users and limitations presented by the technology, I was designing wireframes, prototypes and user-interface.
During the whole project I was acting as a project owner. I was answering questions of the development team, setting priorities and resolving any new issues with the design.
Challenges and solutions
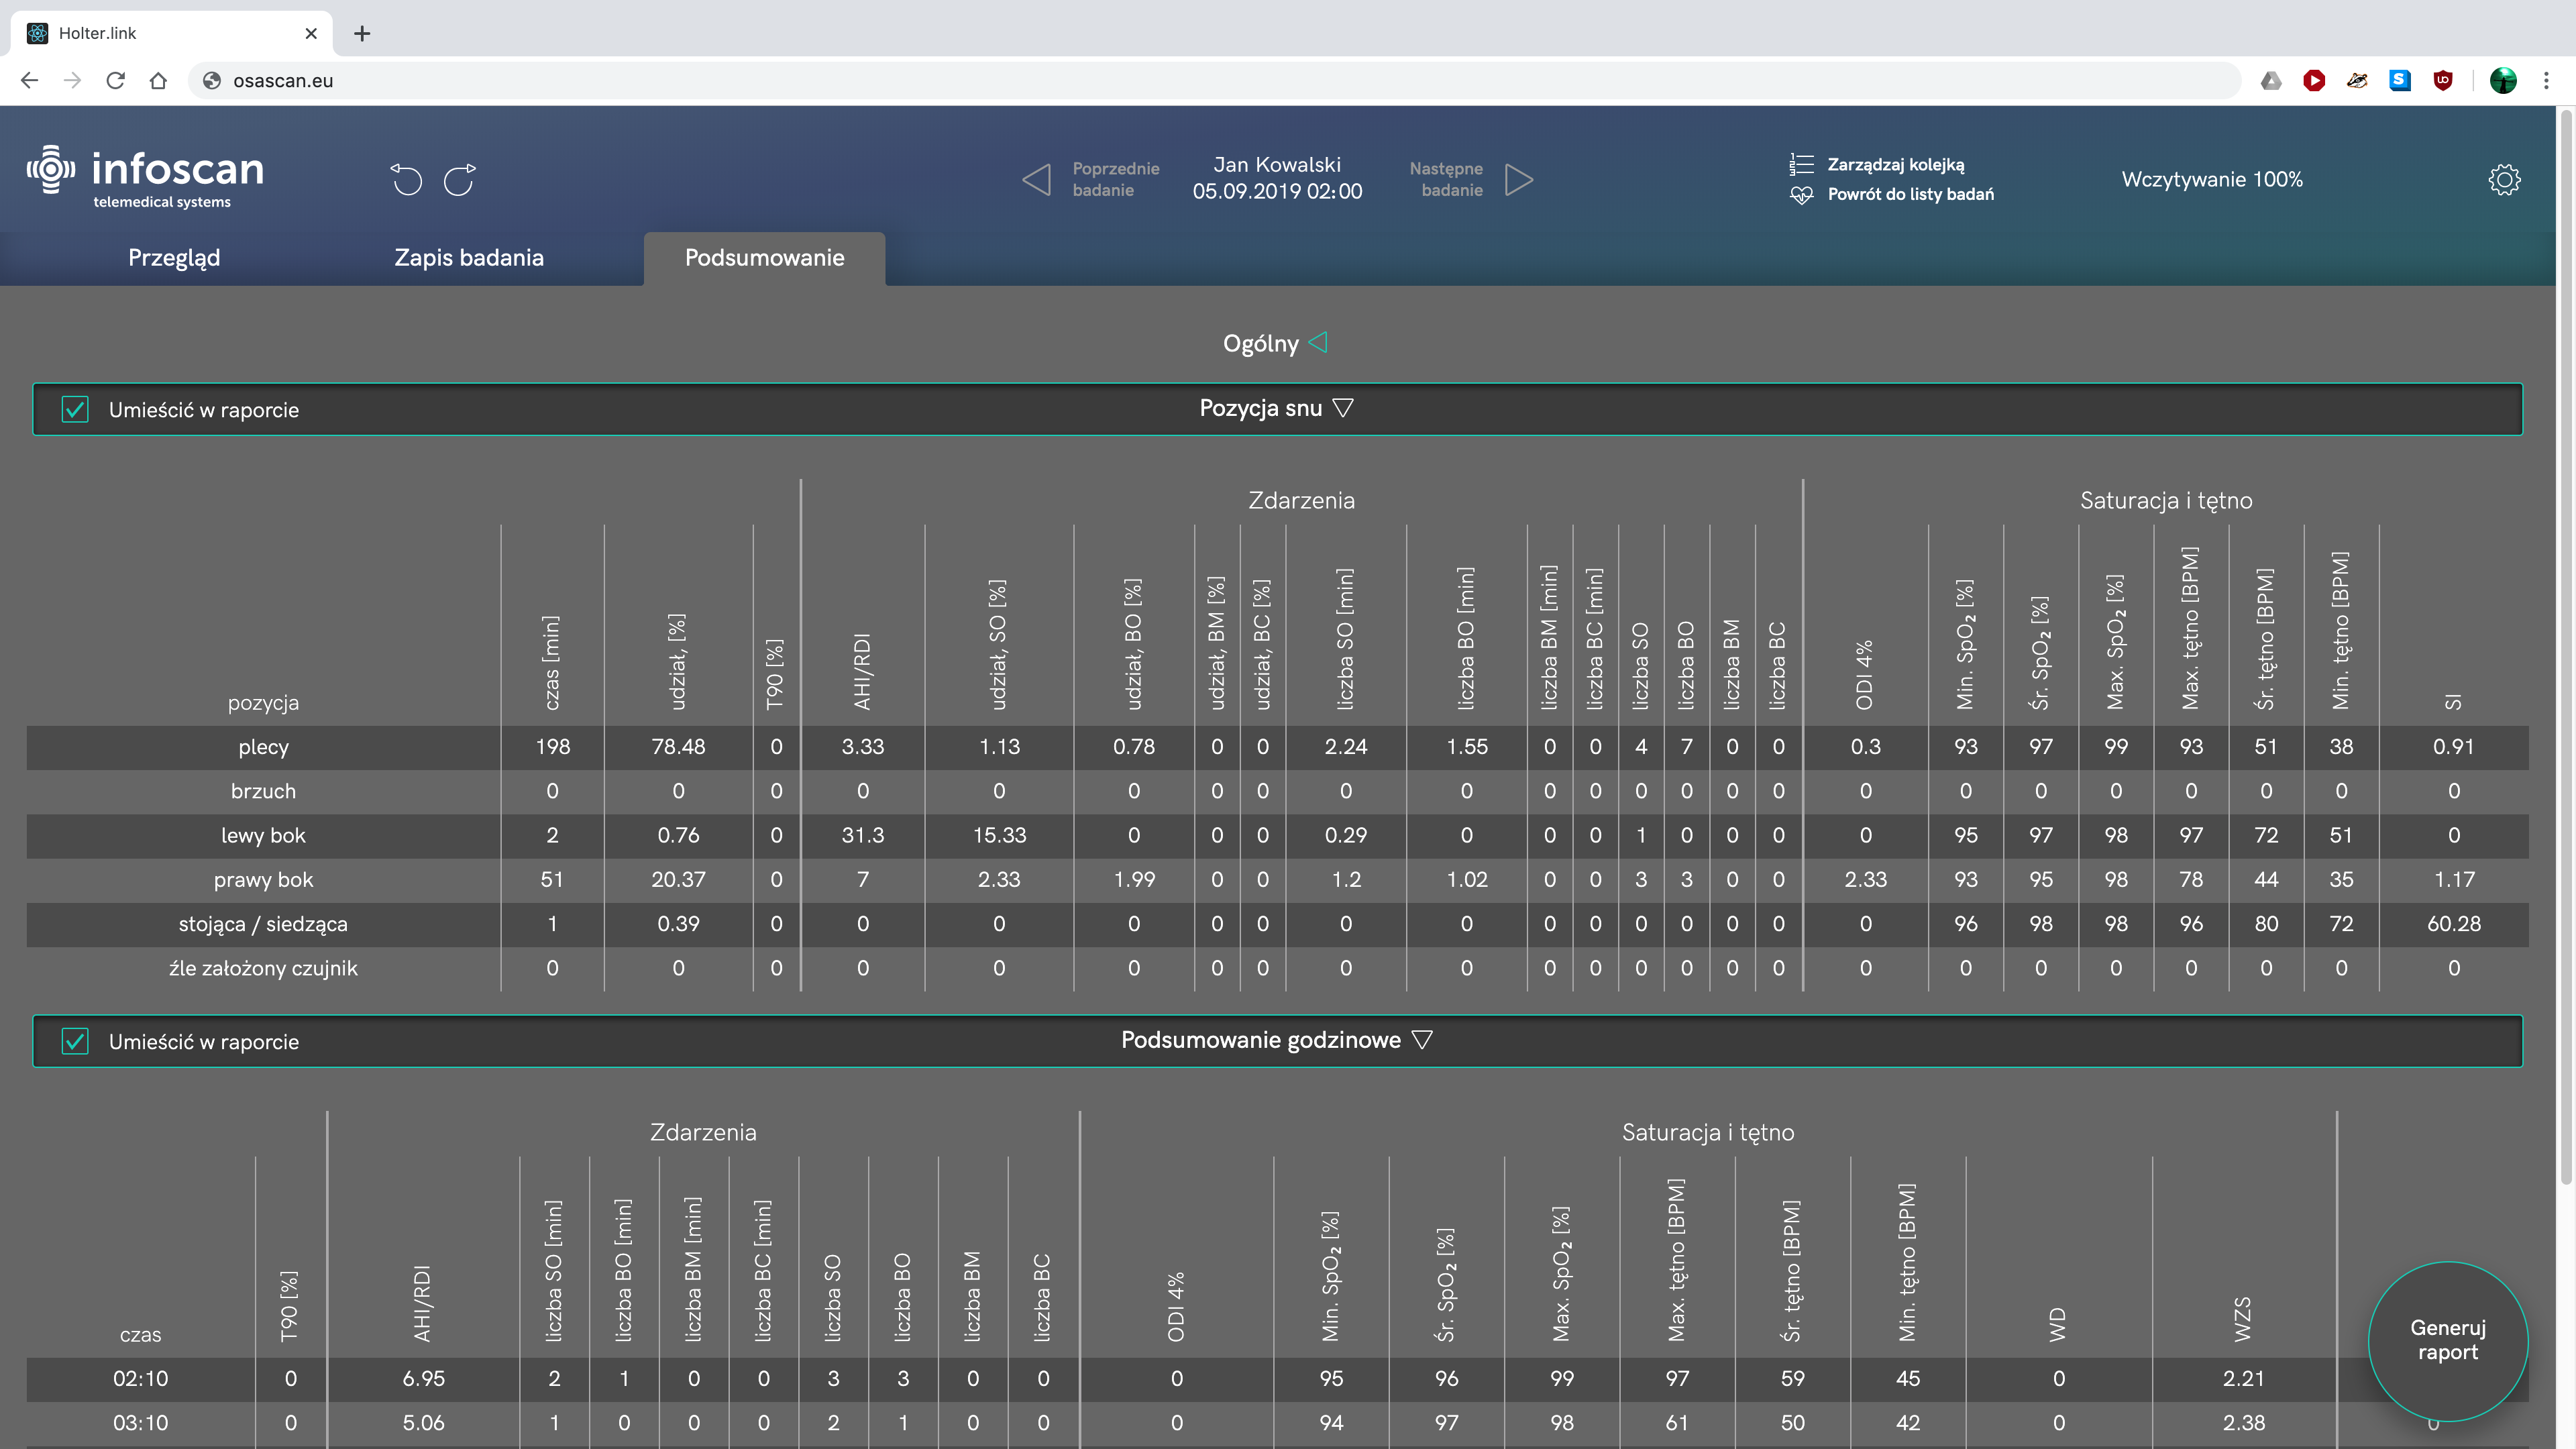
The goal presented during this project was extremely ambitious and we had to spend weeks to determine whether it’s even feasible, because nothing like that has been done before. The client asked us to design and develop a platform where core functionality was to analyze multi-channel, 24 hour long ECG examinations in the cloud on the average computer’s internet browser
Design documentation
Because the project was very complicated and it needed a lot of domain knowledge, the development team had countless questions about specifics of the design, interactions and behaviour. It soon started to take most of my time and it became a bottleneck for the project. I noticed that the same questions were asked numerous times and also I started to successfully predict future questions. I wrote a complete design document consisting of tens of pages explaining every interaction with the interface and effect of every action with references to other project documentation. It played the role of a single source of truth for the project and almost all of the questions stopped. The response from the development team was so positive that we made this an obligatory step in the design process in the company.
Interface
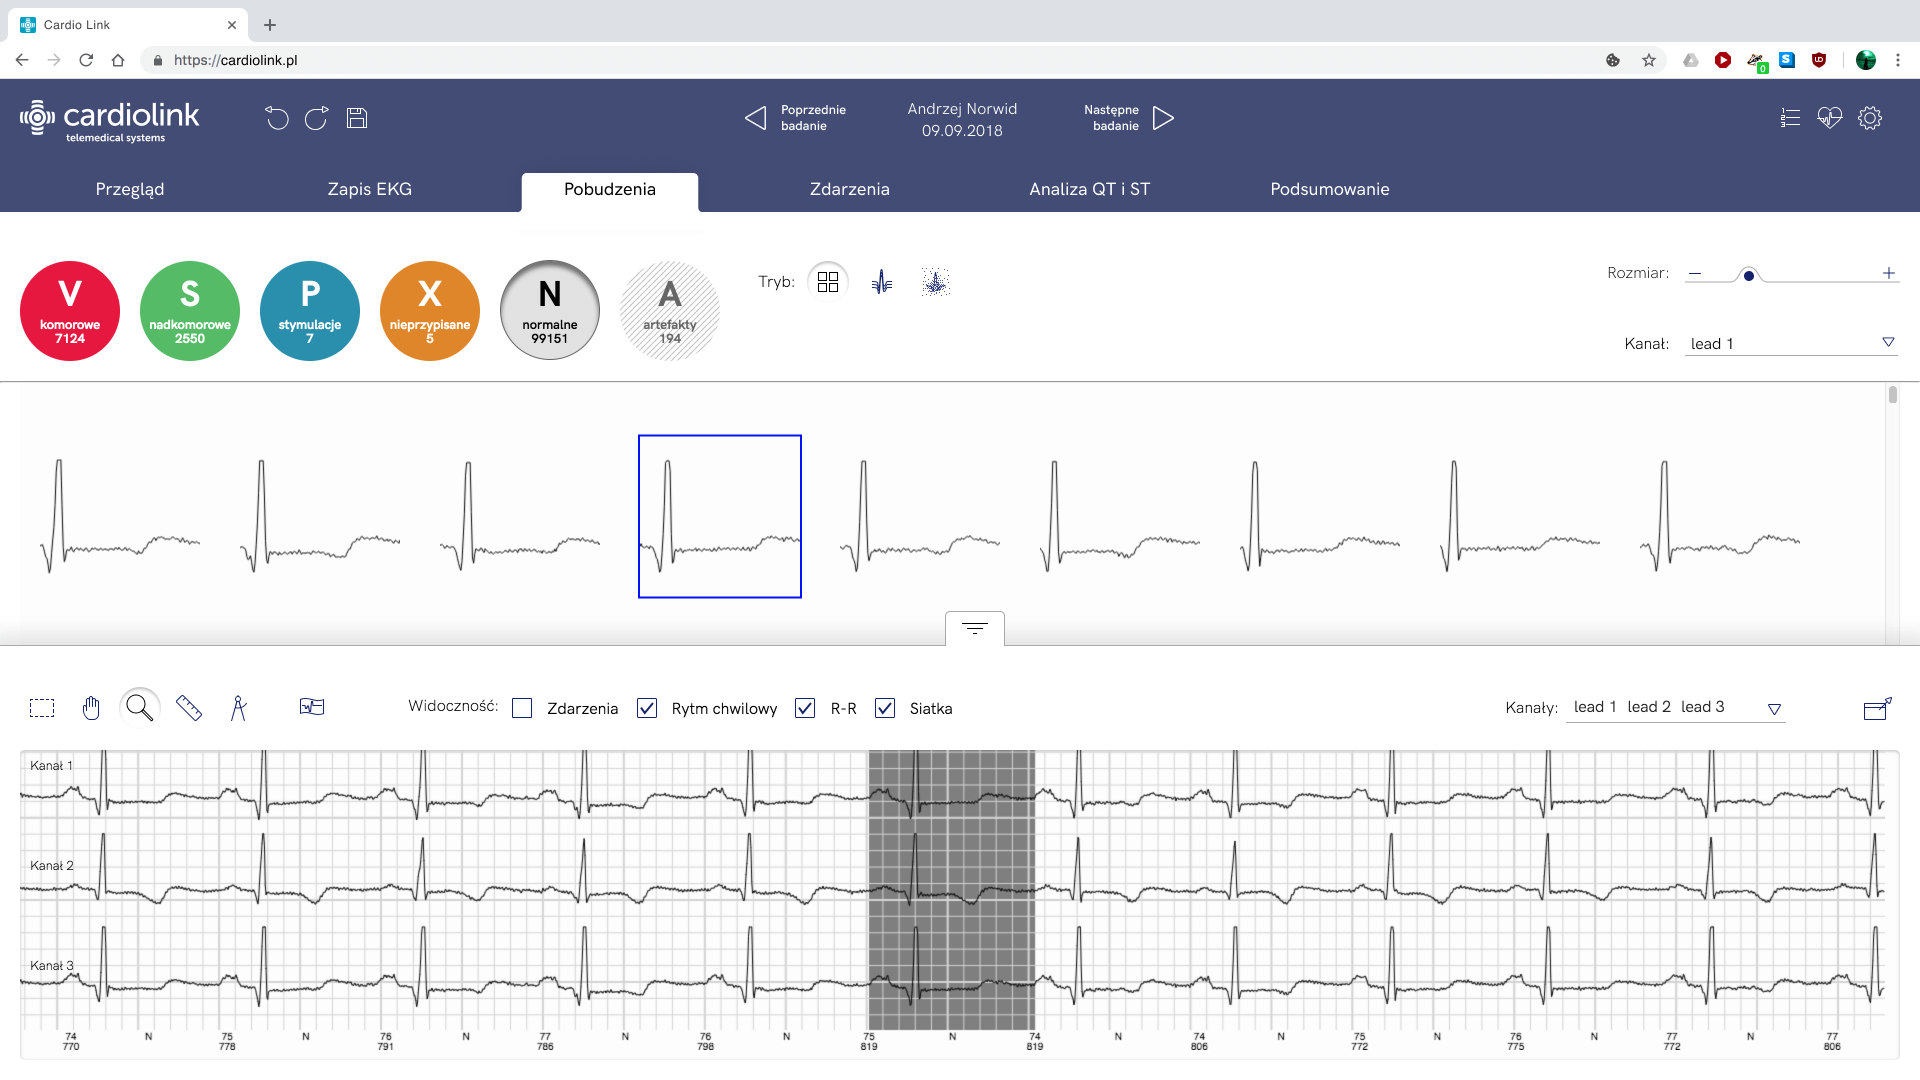
Limited hardware capabilities of the measurement device posed one of the biggest challenges in the project. It lacked one crucial functionality of determining different kinds (morphologies) of heart beats. To find a way to bypass this limitation, during the interviews with the physicians I’ve discussed thoroughly how and why they use this function. I’ve discovered that it is not about the shapes themselves but rather how many of them there were. I’ve added to the system two new ways of displaying ECG data: in a waterfall view (where beats were shown one below another with slight vertical offset) and a heatmap where we were showing beats stacked on top of each other and showed how many times each shape occurred. It allowed users to view how many different kinds of shapes existed in the examination and also allowed for a rough estimate how often they occurred.
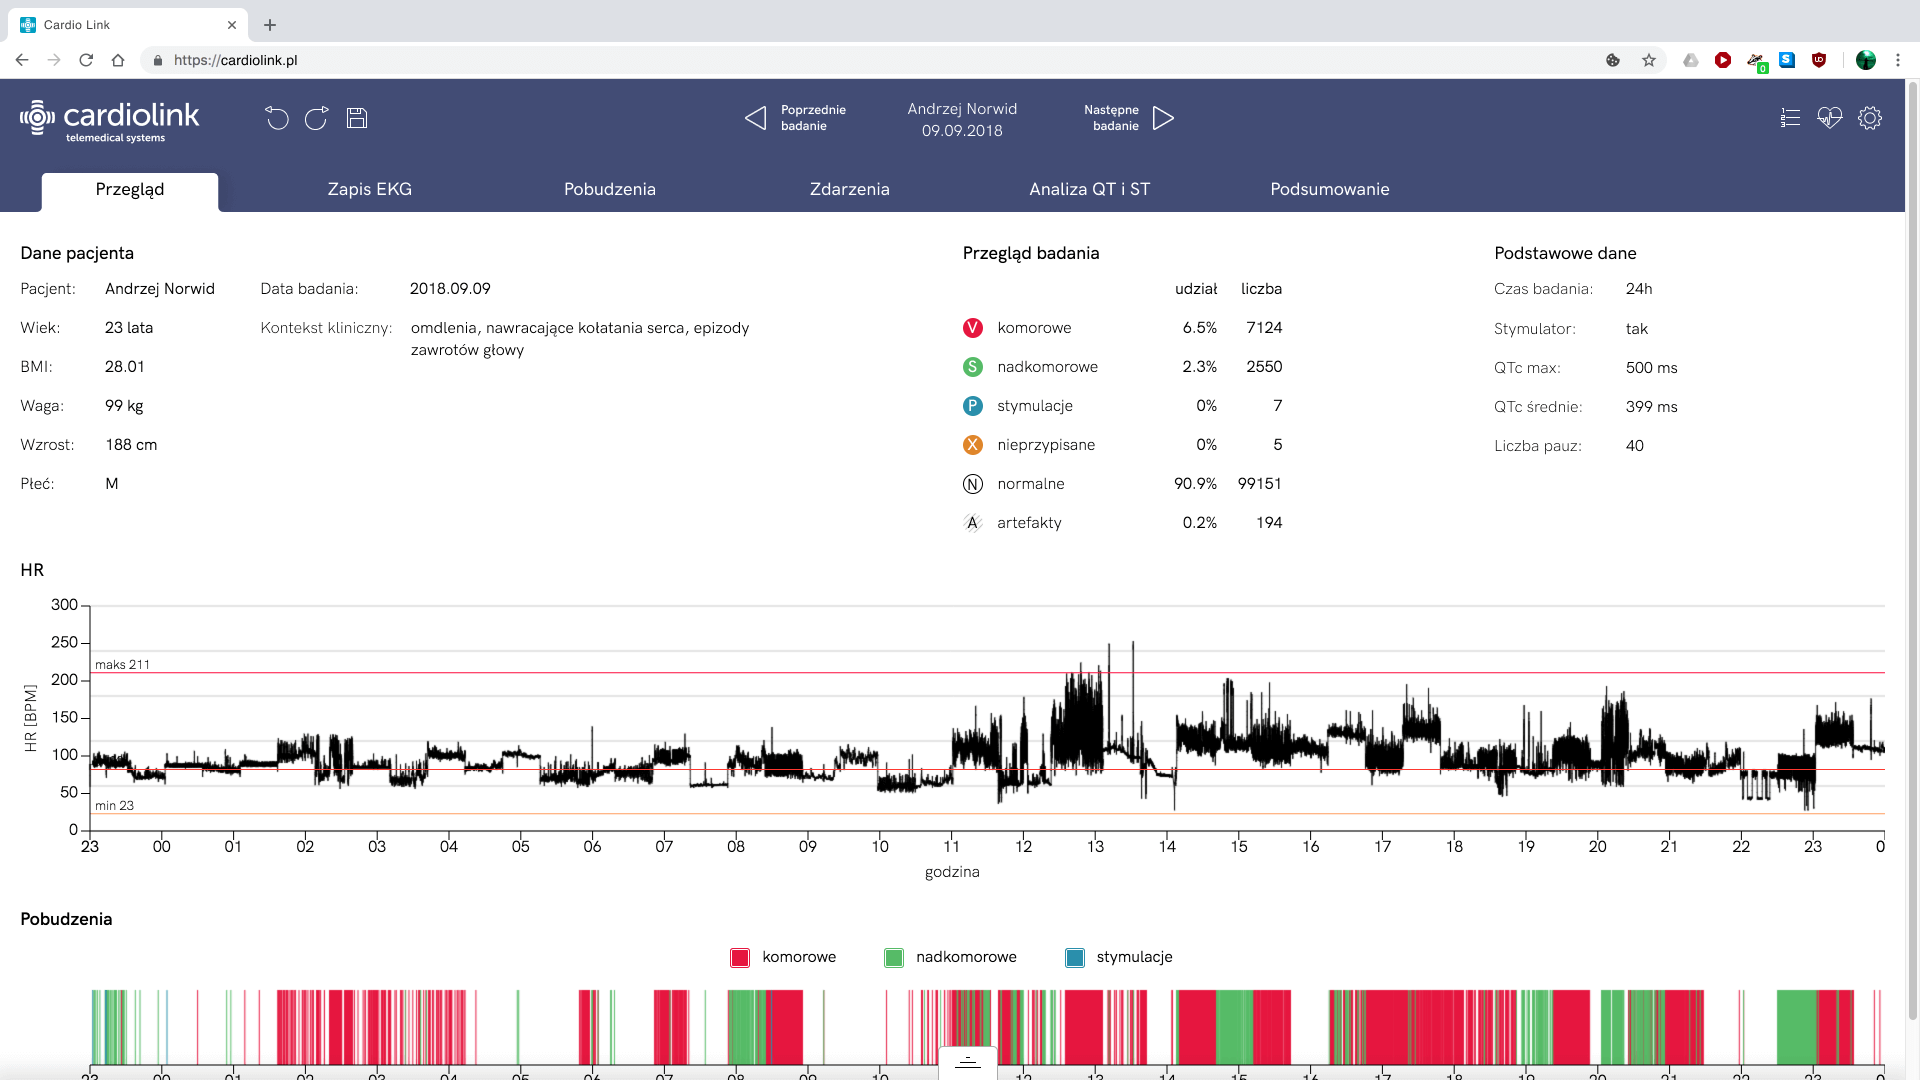
Every ECG holter software allows for viewing the whole 24h long examination. It’s a very long graph that’s hard to navigate. Usually physicians want to look only on the parts where something abnormal happens, like irregular heartbeat or moments of high or low BPMs. To allow for quick overview and easy access to those moments, I’ve designed a unique page scroll combined with a heart rate graph.
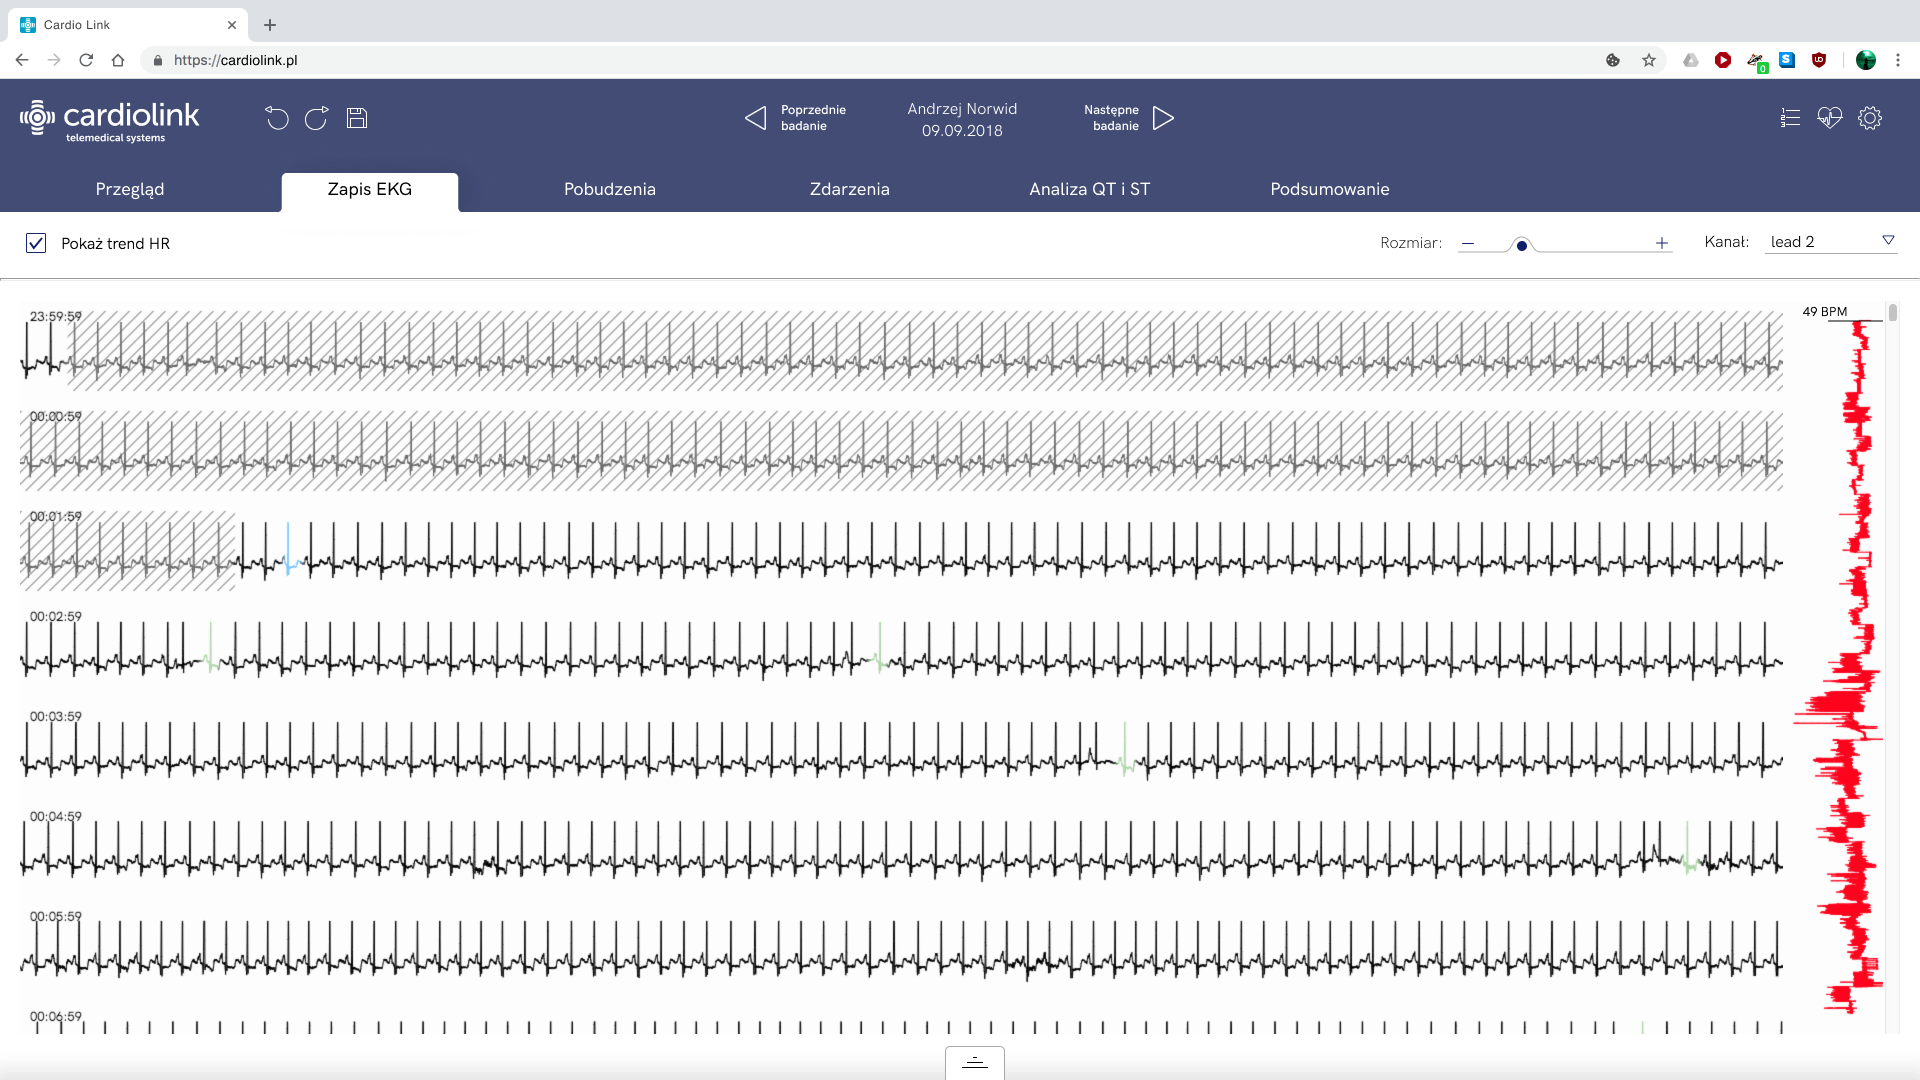
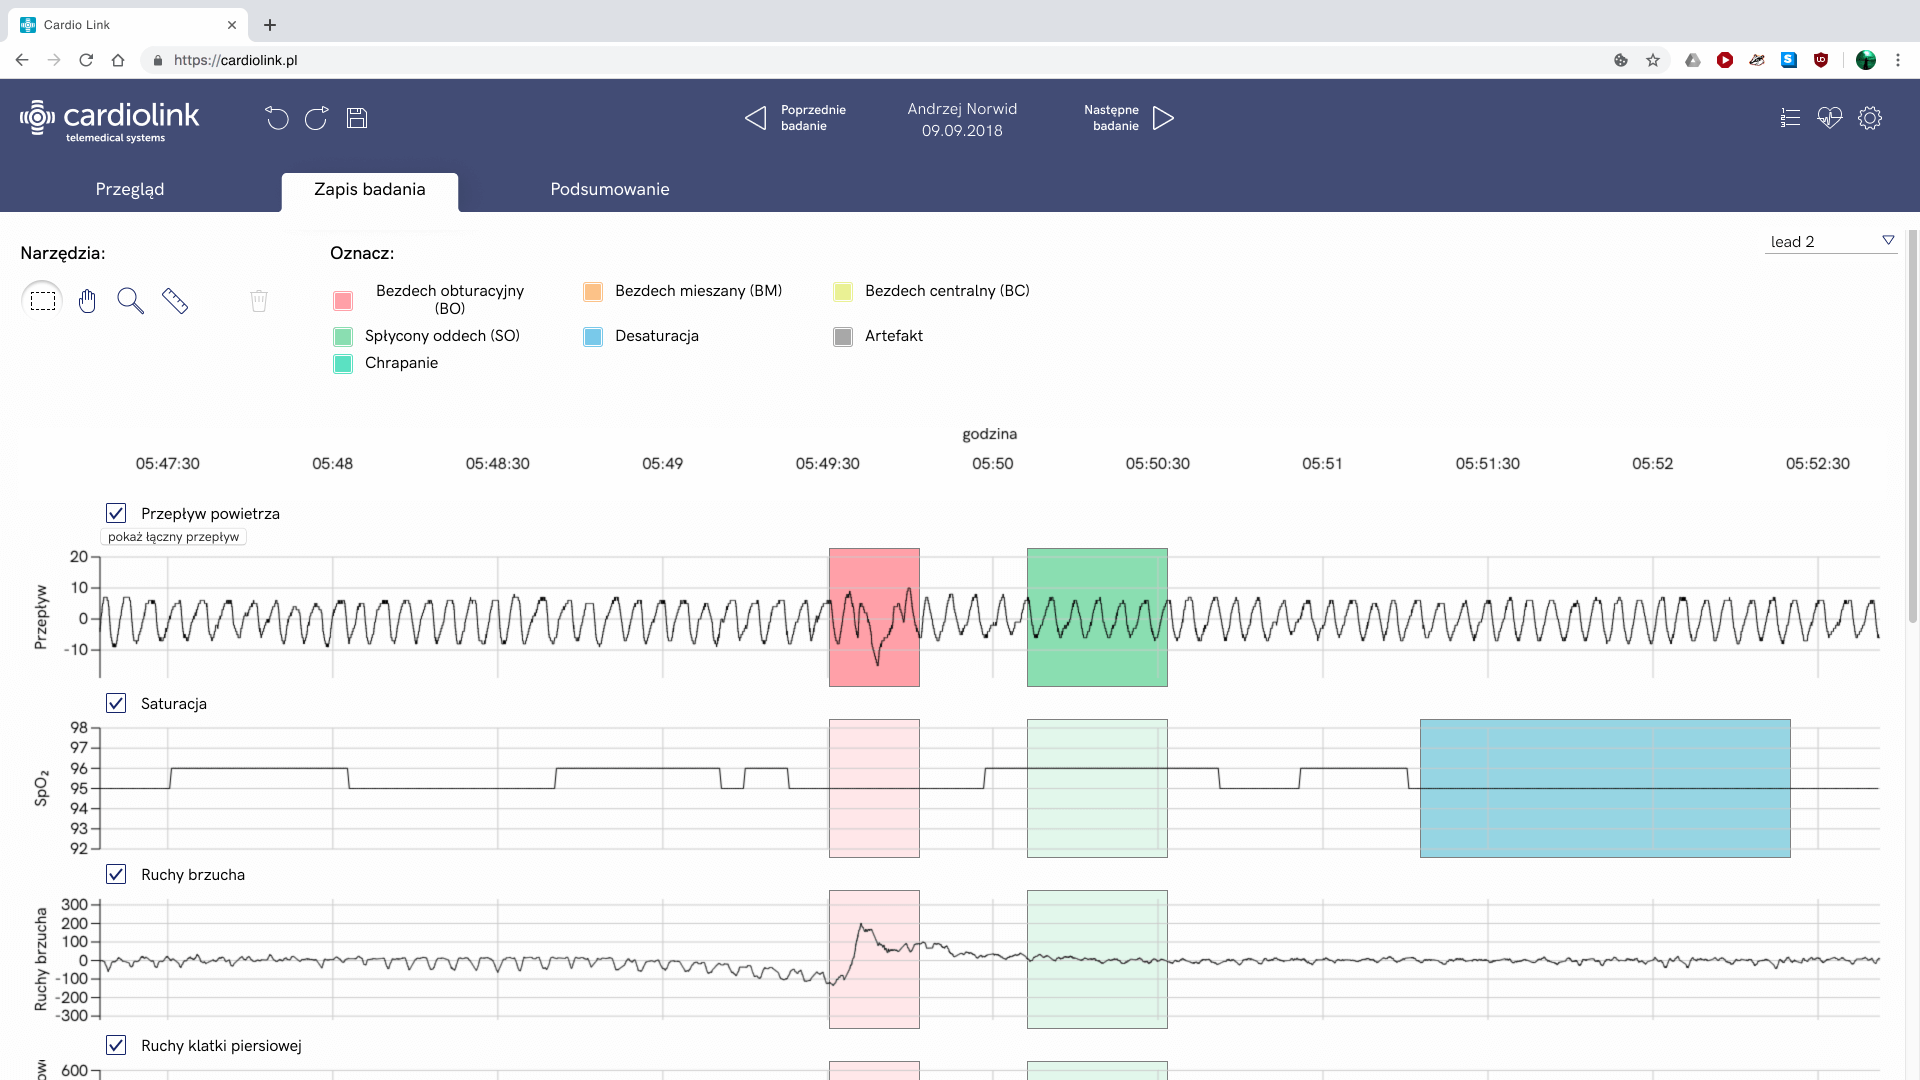
The ECG analysis software is used in various setups and circumstances. Thanks to moving it to the browser, physicians are now able to use it anywhere and anytime, eg. in the evening at home, on a laptop computer or a big dual monitor workstation at the hospital. I’ve designed some functionalities to help with different use cases, like night mode with a dark and lower contrast interface and ability to work in the two separate browser windows (very unique for a web application).
Design system
The whole platform is really big, with hundreds of screens divided into three main areas: infrastructure workers, health care administrators and analysis screens for physicians. It was difficult to maintain consistency among them, especially while having many developers in the team. With the perspective of the future growth of the system I decided to make a design system. Fully built in Sketch thanks to the nested symbols functionality it consisted of common interface elements in every possible state, consistent color palette, shapes and sizes. To share it with the team I’ve introduced a developer handoff software (Zeplin) into the company.